Natural Selection, Classification and Biodiversity
Genetic diversity
Genetic diversity is a measure of the number of different alleles within a population. Within a population it is increased by:
DNA mutations – this can give rise to new alleles.
Migration of individuals with different alleles from another population which reproduce. This is known as gene flow.
Genetic bottlenecks
A genetic bottleneck occurs when a population is greatly reduced in size e.g. if a natural disaster kills most of the population. It has a detrimental effect on genetic diversity because it reduces the number of different alleles in the gene pool. The remaining population reproduce a re-populate the area, creating a new population with less genetic variation.
An example of a genetic bottleneck is the founder effect, which is when a handful of organisms start a new colony. Because the new population originates from a small number of individuals, there are a low number of different alleles in the gene pool and low genetic diversity. The frequency of each allele in the new population can differ greatly from the original population, leading to a higher rate of genetic disease. The founder effect may occur due to geographical separation or reproductive isolation due to religious beliefs (e.g. Amish populations in North America).
Natural Selection
Natural selection is the process by which species evolve. Evolution is the change in allele frequency within a population over time. It can be broken down in the following steps:
There is variation within the population (because different individuals have different alleles). Gene mutations cause new alleles to appear in the population - some of these may be harmful but some may be beneficial.
Organisms with alleles which give them characteristics most suited to their environment are more likely to survive to reproductive age and pass on their genes to their offspring, compared to individuals which do not have the beneficial allele.
A greater proportion of individuals in the next generation have inherited the advantageous allele. These organisms are also more likely to survive and reproduce. They will also pass on the advantageous allele to their offspring.
Over time, the frequency of the advantageous allele increases in the population - this is evolution.

Types of adaptation
Living organisms display features (adaptations) which make them suited to their niche and more likely to survive. These adaptations can be behavioural, physiological or anatomical.
Behavioural adaptations are the way that an organism acts which increase its chances of survival. For example, fish often swim in groups called schools for protection and birds migrate south during the winter to find food.
Physiological adaptations are processes which occur within the body of an organism which increase its chances of survival. For example, sloths have a low metabolism which means they can survive on food which contains a low number of calories. Plants such as the deadly nightshade produce a poison which is a defence against being eaten by animals.
Anatomical adaptations are structural features of an organism which increase its chances of survival. For example, polar bears are camouflaged against the snow and cacti have spines to prevent being eaten by animals.
Types of selection
Natural selection can occur in different ways – it might push a phenotype in a particular direction (e.g. necks of giraffes increasing in length) or it may make the mean phenotype (e.g. birth weight) more common.

Directional selection
Alleles for an extreme phenotype are more likely to be selected for.
Usually triggered by a change in the environment.
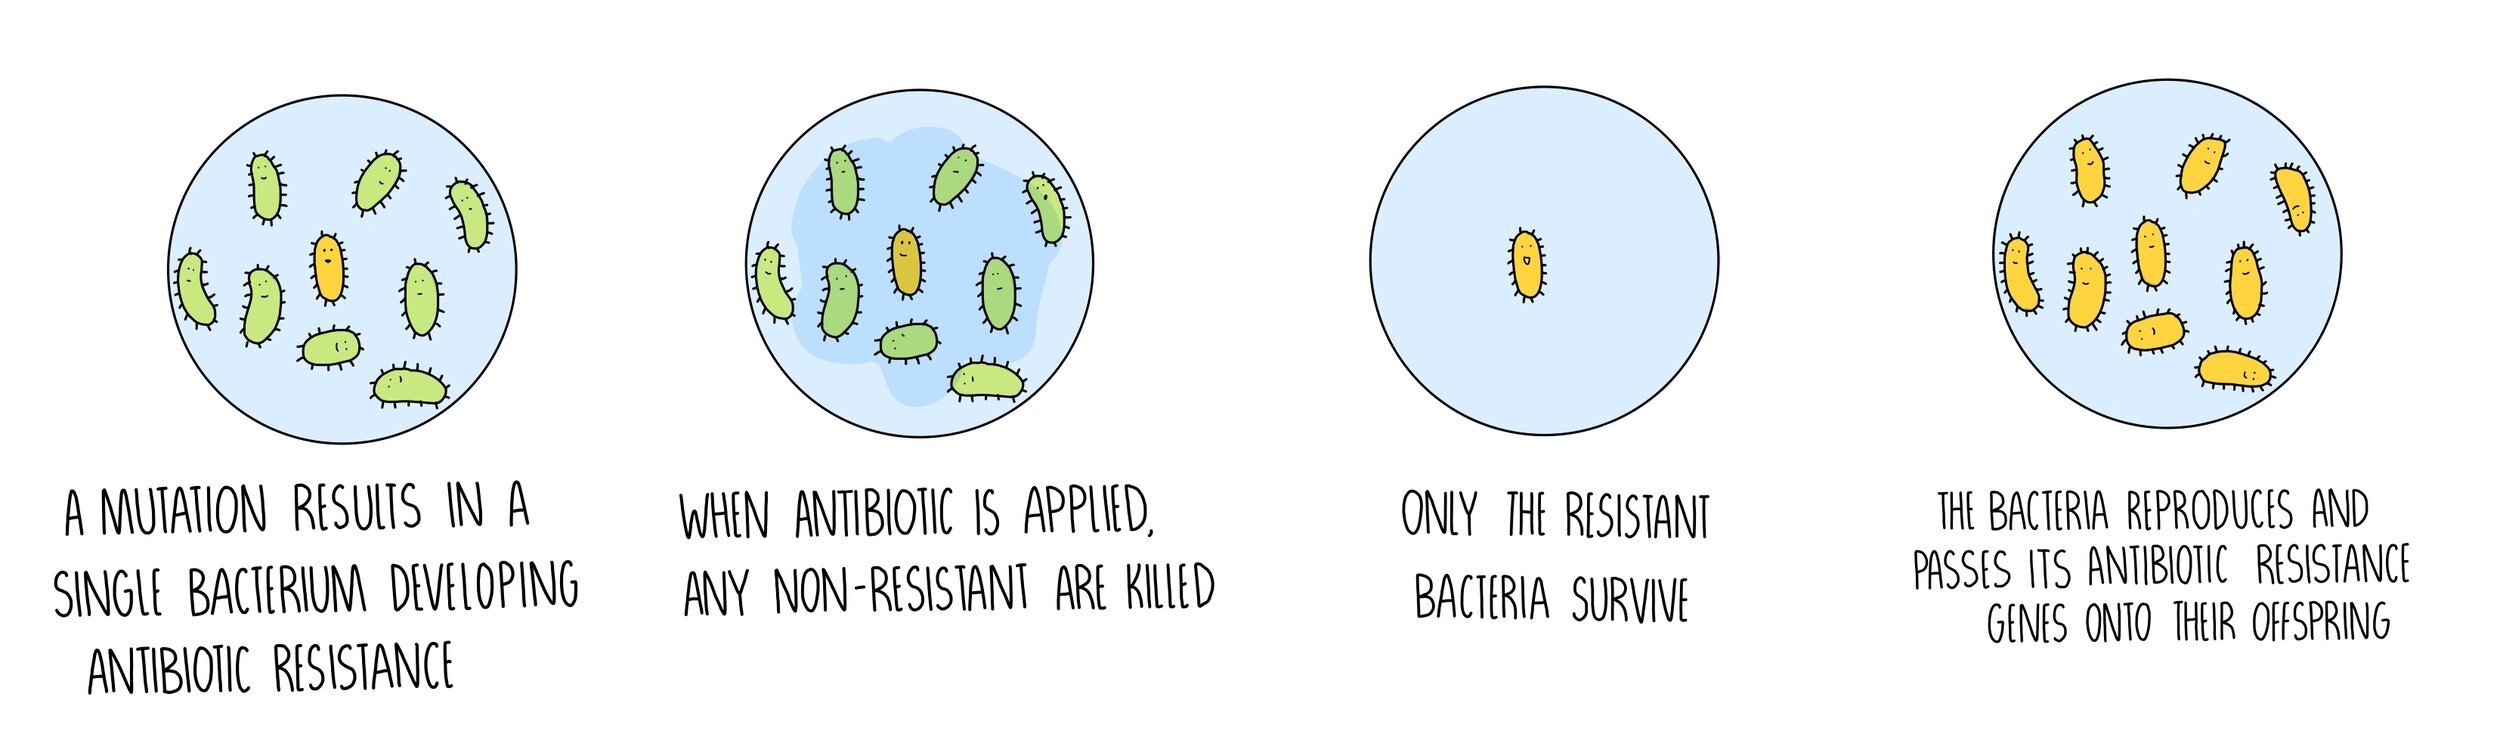
E.g. development of antibiotic resistance in bacteria.
A mutation in a bacterium enables it to develop resistance to an antibiotic.
When antibiotic is used (the selection pressure), the resistant bacterium survives while the rest are killed.
The bacterium can grow without competition and reproduce, passing on its resistance allele to its offspring.
This produces a population of bacteria which carry the antibiotic resistance allele.
Stabilising selection

Alleles for an average phenotype are more likely to be selected for.
Occurs when environmental conditions remain stable.
Reduces the range of possible phenotypes.
E.g. human birth weight
Underweight babies are less likely to survive as they lose a lot of body heat.
Overweight babies are more likely to lead to childbirth complications.
Alleles for a mean birth weight are more likely to survive and reproduce, passing on their average weight alleles onto their offspring.
Testing antibiotics
The efficiency of different antibiotics (or plant extracts containing antimicrobial substances) can be tested by soaking pieces of filter paper in the antibiotic solutions and placing on a Petri dish containing bacteria. The stronger the antibiotic, the more bacteria are killed. Regions of the Petri dish where bacteria have been killed will appear as a clear zone - the size of the clear zone is proportional to the strength of the antibiotic. The experiment is carried out by carrying out the steps below:
Prepare a nutrient broth containing bacteria and add the same volume of the broth to a series of Petri dishes.
Using a sterile plastic spreader spread the bacterial broth evenly across the Petri dish. Remember to keep the lid on the Petri dish wherever possible.
Using sterile forceps, place a disc of filter paper into each antibiotic solution then place far apart on the Petri dish. It is important to keep all control variables (soaking time and size of the disc) the same for each antibiotic.
Incubate the Petri dishes at 25oC for 24 - 48 hours. It is important that the temperature is not higher (anywhere around 37oC) since this would pose the risk of growing human pathogens.
Measure the area or the diameter of each clear zone.
Repeat the experiment at least three times and calculate the mean area of the clear zone for each antibiotic.
Aseptic Techniques
When carrying out experiments involving bacteria, it is important to carry out aseptic (sterile) techniques. This is because bacteria are everywhere - all over your hands, in your breath and covering the lab surface - and you don’t want cross-contamination to interfere with your results. Aseptic techniques include the following:
Use of sterile equipment - this can be done using a machine called an autoclave which looks like a dishwasher but uses steam and high pressure to sterilise the equipment.
Disinfect the lab bench and work surfaces.
Wear gloves.
Place a Bunsen burner near to your work space when transferring bacteria from one container to another. The heat from the flame draws any microorganisms in the air away from the work space because hot air rises.
Close windows and doors to prevent draughts blowing microbes towards you.
Classification and taxonomy
To make it easier for scientists to identify and study living organisms, each organism is organised into different groups based on their similarities and differences. The grouping of organisms according to their characteristics is called taxonomy. There are eight different taxonomic groups used to classify organisms. The groups are organised in a hierarchy from largest to smallest. The first group, domain, is the most broad category whereas the last group, species, is the most specific category. These groups do not overlap with one another, so an organism which is placed in the kingdom ‘animals’ will not share the same categories as an organism which belongs to the plant kingdom.
It’s useful to use a mnemonic to help you remember the order of the taxonomic groups. The classic one is ‘Dear King Phillip Came Over For Good Soup’ but my favourite is ‘Delicious King Prawn Curry Over Fatty Greasy Sausages’.

Binomial system
In the past, organisms were referred to by local and colloquial names and there were often hundreds of different names used to refer to the same organism. To make things more straightforward, scientists now use the binomial system for naming organisms. This two name system uses first the genus name and then the species name to refer to each organism. The scientific name for human beings is Homo sapiens since ‘homo’ is the genus name and ‘sapiens’ is the name of our species. Likewise, the scientific name for the chimpanzee is Pan Troglodytes, which makes ‘pan’ the name of the genus and ‘troglodytes’ the name of the species.

Molecular Phylogeny
Scientists often use data from molecular phylogeny studies to decide which organisms to place into which categories. Molecular phylogeny is the study of molecules (such as DNA, RNA or amino acids) within an organism. Scientists will first choose a gene which is present in the two organisms that they want to compare and then line up the DNA base sequence or amino acid sequence. By looking at how similar these sequences are, the scientists can determine how closely related the two organisms are. The more differences in the nucleic acid or amino acid sequence, the more distantly related the two organisms and the further back in time they shared a common ancestor.
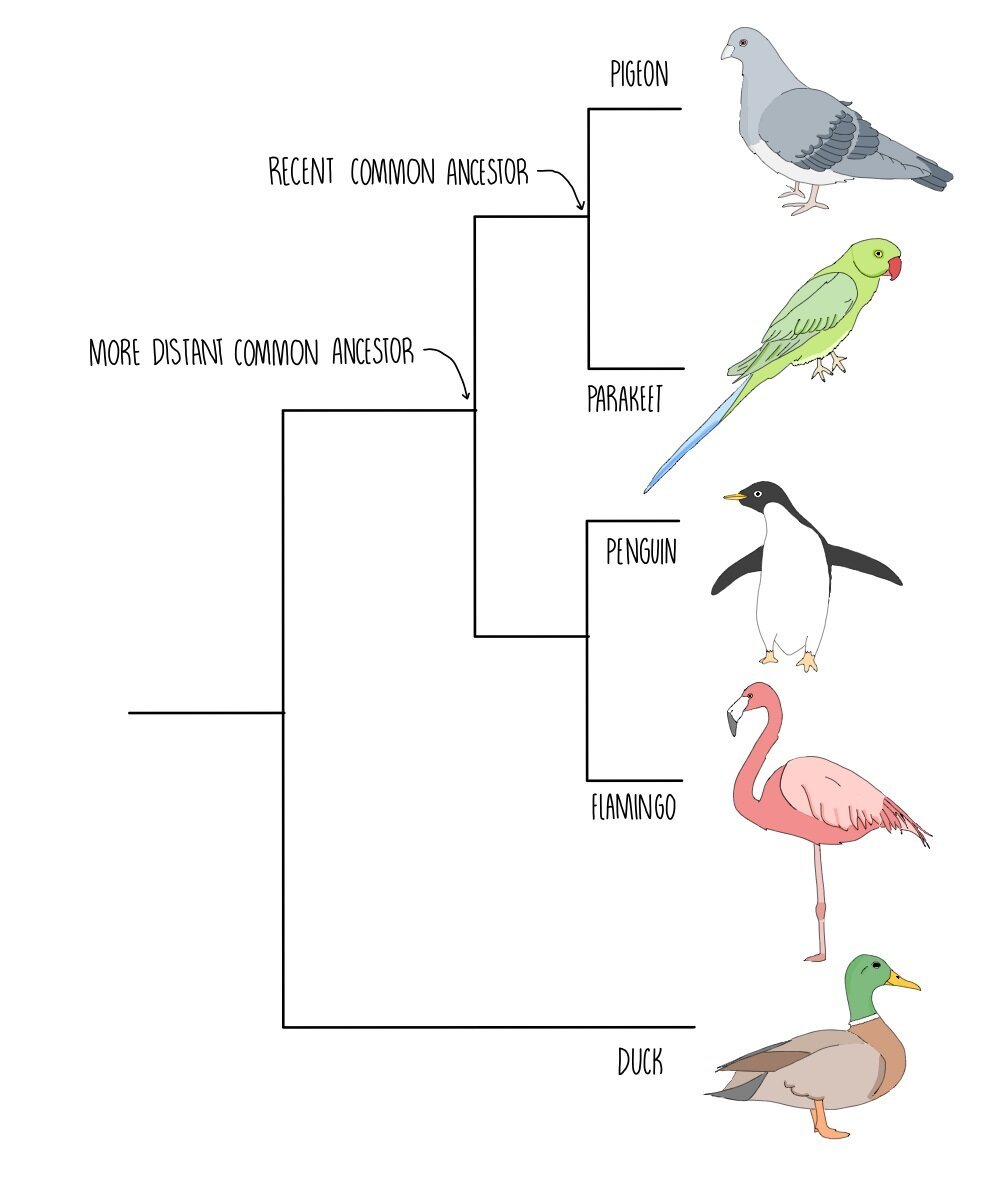
This can be shown on a phylogenetic tree like the one pictured here. The first branch point represents a common ancestor of all the bird species, which is now extinct. The tree shows that ducks were the first group to diverge and become a separate species. Closely related species diverged away from each other more recently. For example, pigeons are more closely related to parakeets than penguins as they share a more recent common ancestor. You would therefore expect pigeons to share more DNA bases in common with parakeets than penguins.
Courtship behaviour

Courtship display by a male peacock spider. Credit: Jurgen Otto (Flickr)
Courtship behaviour is useful to scientists trying to classify species because it is highly species-specific. Only members of the same species will carry out and respond to a particular pattern of courtship behaviour. It provides a means for members of the same species to recognise each other and avoid breeding with an organism of a separate species, increasing the chances of successful reproduction. This means that courtship behaviour can be used to classify organisms and study the evolutionary relationships between different species. Two species that share a recent common ancestor will have fairly similar courtship rituals.
Courtship behaviour is highly varied. Butterflies release chemicals to attract females while fireflies give off pulses of light with a specific pattern. Male peacocks use their bodies to attract mates, showing off their elaborate tails.
Investigating variation
High phenotypic variation is a result of high genetic diversity – the more alleles in the gene pool, the greater the number of possible characteristics. Variation may also occur due to differences in the environment. Most variation is caused by a combination of both genes and the environment. For example, you can possess alleles for growing tall but malnutrition will limit your actual height.

To investigate variation, you take a sample of the population and use it as a model of the whole population. Studying the entire population would be too time-consuming and labour-intensive. It’s important that your sample is random to ensure unbiased results. You can select a random sample by dividing the habitat into a grid and using a random number generator to select coordinates. To determine whether there is a significant difference between your results (the differences aren’t just due to chance), you have to perform a statistical test.
You can then plot the variation in phenotypes on a graph. You may wish to add error bars to represent standard deviation. Standard deviation is a measure of the spread of values about the mean. Error bars extend one standard deviation above and one standard deviation below the mean, so the total length of the error bar is twice the standard deviation. The larger the error bar, the greater the amount of variation in the data.
Ecology definitions
Biodiversity - the variety of living organisms in an area. High biodiversity means there are lots of different species.
Habitat – an area where an organism lives
Community – all of the different species in a habitat that interact with each other
Index of Diversity
Species diversity can be measured by calculating the Index of Diversity (D) of a particular habitat. It takes into account both the number of different species and the abundance of each species. The larger the value for the Diversity Index, the more biodiverse the habitat is. It is calculated using the following equation:

You should be given this formula in the exam so there is no need to memorise it! But you do need to remember what each component of the equation represents. N is the total number of organisms of all species living in that habitat and n is the number of organisms of a single species. Look at the example below to see how the Index of Diversity is calculated:
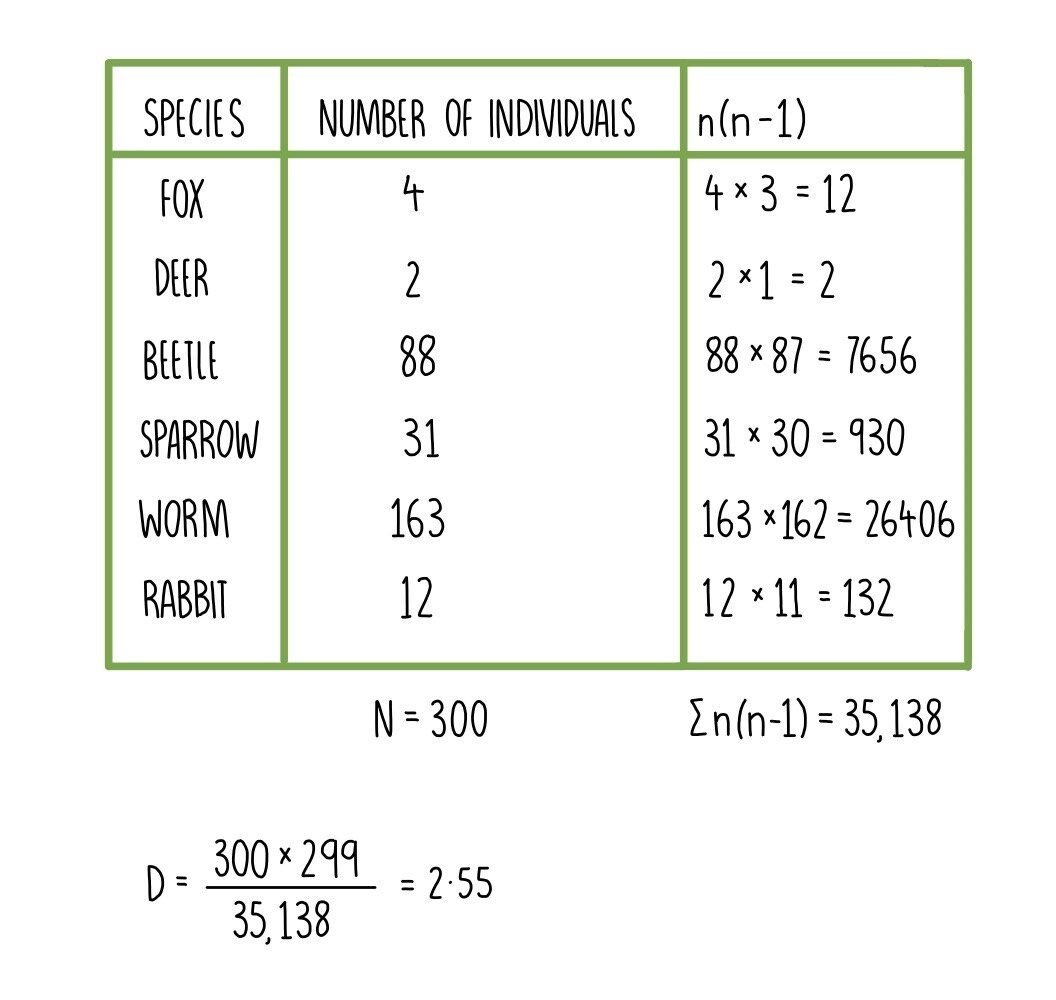
The table below shows the species present in a woodland habitat and their population size.

When calculating the Index of Diversity, the best way to organise your answer is to add another column to the table to work out n (the population size of each species) x n-1. We will then add all of these values together to work out the sum of n(n-1). We also need to add together the population sizes of all the species to get a value for N, which is then multiplied by N-1. Our N(N-1) value will be divided by the Σn(n-1) value to calculate the Index of Diversity (D). A value of 1 means there is no diversity at all (i.e. only one type of species is living in the habitat). As biodiversity increases, D also increases.
Impact of agriculture on biodiversity
Agricultural practices reduce biodiversity in the following ways:
Pesticides kill pests that feed on crops. This reduces biodiversity by killing the pests and reducing the food sources available to the animals that feed on them.
Herbicides kill weeds, reducing plant diversity and reducing the food sources available to primary consumers.
Removal of hedgerows – farmers remove hedgerows to convert smaller fields into bigger ones. This destroys habitats, removing shelter and food sources for small mammals and insects.
Deforestation or woodland clearance is carried out to increase the area of available farmland. Like hedgerow removal, it destroys habitats and reduces biodiversity by getting rid of shelter and food sources.
The original habitat is replaced with a monoculture – this is when only one type of plant is grown. This reduces biodiversity both directly (by replacing many species with just one) and indirectly (by reducing the number of food sources/habitats available to other species).
Biodiversity can be protected through conservation schemes:
Endangered species can be given legal protection
Habitats can be protected by making them Sites of Special Scientific Interest (SSSIs) which limits development within the area.
Farmers can be encouraged to conserve biodiversity by avoiding the use of pesticides or replanting hedgerows.