Statistical Tests
Alright, I know it’s boring but statistical tests are important for scientists to determine whether differences between data sets are significant or if it is due to natural variation. Read through this page to learn how to carry out different statistical tests then test yourself with some past paper questions to make sure you’ve got it.
Chi Squared Test
The chi squared test is a statistical test that is used to see if the results gathered during an experiment (the observed results) are what we expected to find (the expected results). We first have to state the null hypothesis - the null hypothesis is always that there is no significant difference between the observed and expected results. The chi squared test will allow us to either accept or reject the null hypothesis.
Look at the example described below to see how you would do this:

Let’s say you’re carrying out an experiment to determine the genotypes of two organisms for a particular trait. A gene which determines flower colour is controlled by 2 alleles - the dominant allele (P) gives rise to purple flowers and the recessive allele (p) produces white flowers. If two heterozygous purple flowers are crossed, we would expect to see a 3:1 ratio of purple flowers to white flowers in the offspring - these are our expected results.
Now we’ll cross-breed the two plants and determine the number of offspring showing each phenotype. An example is shown in the table below:

Then we use these results to calculate a value for chi squared. We do this by calculating the difference between the observed and expected result (O - E). We then square that number (O - E2) and divide that value by the expected result ((O - E2)/E). The values obtained for both phenotype need to be added together to get our chi squared value.

This can be summarised using the formula below. You don’t need to memorise this formula - you’ll be given it in the exam.

The last thing you need to do is to compare your chi squared value to the critical value. The critical value is the value of chi squared that corresponds to a 0.05 (5%) level of probability that the difference between our observed and expected results is due to chance. If your chi squared value is larger than or equal to the critical value then there is a significant difference between the observed and expected results. This means that something other than chance is causing the difference in the results and the null hypothesis can be rejected. However, if your chi squared value is smaller than the critical value that means there is no significant difference between the observed and expected results. This means any difference between the observed and expected results is the variation you’d expect due to chance and the null hypothesis can be accepted. In this case, this means that our theory that petal colour follows a monohybrid pattern of inheritance is supported.
You may have to work out the critical value for yourself from a table. The table will give you different critical values for different probability levels at different degrees of freedom. The degrees of freedom is equal to the number of groups in the experiment (in this case, the number of different phenotypes) minus one. We had two different phenotypes (purple and white) so our degrees of freedom = 1.
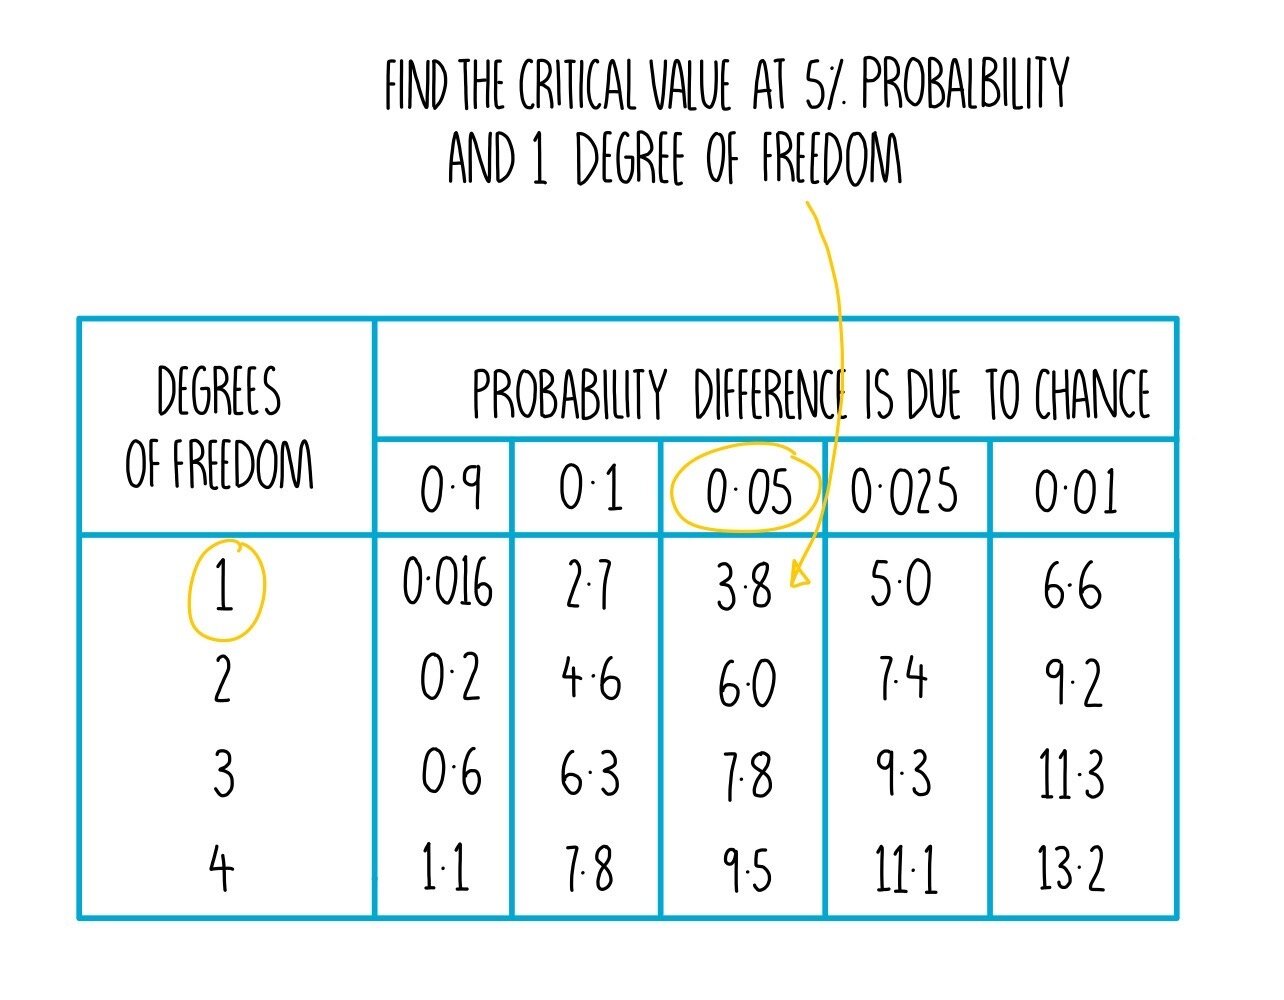
In our experiment, we obtained a chi squared value of 7.7. The critical value at 5% probability (0.05) and 1 degree of freedom is 3.8. Our chi squared value is larger than the critical value which means there is a significant difference between the observed and expected results. The difference is due to something other than chance so we need to reject the null hypothesis. Our results show that the plants we were breeding were not heterozygous or that petal colour in these plants does not follow a simple monohybrid pattern of inheritance.
Student’s t-test
The Student’s t-test is used to determine whether the means for two sets of data are significantly different. For example, let’s say that an experiment was carried out to test the effects of a type of drug called a statin on the concentration of blood cholesterol. One group is made up of 8 men who received a placebo (an inert substance) and the other group is made up of 8 men who received the statin. After a two week period, blood samples were taken and the levels of cholesterol were recorded.

To see if the treatment has had an effect on cholesterol levels (i.e. that any differences are not just due to chance), we will need to carry out a student’s t-test. We do this by carrying out the following steps.
State the null hypothesis - this is always that there is no significant difference between the means of the two groups i.e. there is no significant difference between the men who received the placebo and the statin treatment.
Use the formula below to calculate a value for t.

Putting in the mean values for each group, the standard deviations and the group size, we can work out a value for t as follows:

3. Compare your t value to the critical value. To work out the critical value from a table of critical values, you first need to work out how many degrees of freedom you have. The degrees of freedom is calculated by doing (n1 + n2) - 2. In our experiment, there is eight individuals in each group so we do (8 + 8) - 2 = 14. We then need to find the critical value at 14 degrees of freedom and a probability of 0.05 (5%). This means that were is a less than 5% chance that any differences between the two groups is due to chance.

4. Determine whether the two means are significantly different - if the value obtained from the t-test is greater than the critical value at a probability of 5% or less, then you can be 95% confident that the difference between the two means is significant and not simply due to chance. You can reject the null hypothesis. In our example, our t-test value of 4.76 is greater than the critical value (2.14) so we can conclude that there is a significant difference in blood cholesterol concentration between individuals receiving treatment compared to the placebo.

Did you know…
If you were to remove all the empty space from the atoms that make up every human on earth, the world population (all seven and a half billions people) could fit into an apple.